
Data visualization has become a crucial part of modern business strategies, as organizations seek to make sense of enormous amounts of data and make informed decisions. Two leading players in the data visualization space are Tableau and Power BI, both create visually appealing and interactive dashboards. But which one is better- Tableau or Power BI?
In this blog, we will conduct an in-depth comparison of these two data visualization tools, exploring their features, functionality, ease of use, pricing, and more.
What is Power BI?
Power BI is a Microsoft-powered business intelligence solution designed for building scalable and unified solutions for enterprises. It allows users to connect to multiple data sources, transform and clean the data, and create visualizations and reports using a drag-and-drop interface.
Additionally, it comes with a wide range of data connectors to connect with multiple data sources such as Excel, SQL Server, Azure, and other popular databases. Power BI offers both cloud-based and on-premises deployment options. It also supports natural language queries and offers features for data modeling, data analysis, and data sharing.
Pros and Cons of Power BI
Pros:
- Natural Language Processing (NLP) capability
- Seamless Integration with Microsoft products, such as Azure cloud services and Office 365
- Self-Service analytics capabilities empowering business users to create their own visualizations without relying heavily on IT or data teams.
- Broad Data Connectivity to connect to various data sources, including Microsoft products like Excel and SQL Server, as well as third-party databases.
Cons:
- Steeper learning curve
- Limited advanced analytics
- Performance issues with large data sets
What is Tableau?
Tableau is a data visualization and analytics tool developed by Tableau Software, which is now part of Salesforce. It has a drag-and-drop interface to allow users to create interactive dashboards and visualizations in minutes. Besides its visualization capabilities, tableau allows users to explore data through ad-hoc analysis.
Pros and Cons of Tableau
Pros:
- Intuitive Interface to create interactive dashboards and reports without writing any code.
- Advanced analytics capabilities including predictive analytics, machine learning integration, and statistical analysis
- Manage massive data sets, making it a suitable choice for organizations with large-scale data requirements.
- Broad data connectivity and flexible data integration
Cons:
- Steeper learning curve for users who are new to data visualization or analytics
- Expensive, especially for enterprise-level subscriptions with advanced functionalities, which may impact the budget for smaller organizations or individual users.
- Requires additional steps or customization for seamless integration with Microsoft products
Tableau vs Power BI: In-Depth Comparison
Features and Functionality:
Tableau or Power BI, which one to select? To get to any conclusion, you need to compare both on the following important features and functionalities.
Data Connectivity: Both Tableau and Power BI support a wide range of data sources, including popular databases, cloud-based platforms, spreadsheets, and more. However, Power BI has an edge in terms of seamless integration with other Microsoft products such as Excel, Azure, and SQL Server, making it a preferred choice for organizations already using Microsoft technologies.
Visualization Capabilities: Tableau is known for its rich and diverse visualization options, with over 100 pre-built visualizations and advanced features such as mapping and custom calculations. Power BI, on the other hand, offers a wide array of visualization options, but may not be as feature rich as Tableau.
Data Preparation: Power BI has an advantage in terms of data preparation capabilities, offering built-in data modeling and transformation tools. Tableau, on the other hand, relies on third-party tools for data preparation outside of the platform.
Collaboration and Sharing: Both Tableau and Power BI allow for easy sharing and collaboration of dashboards and reports. However, Power BI has an edge with its integration with Microsoft Teams, making it a convenient choice for organizations already using Microsoft’s collaboration tools.
Ease of Use:
When it comes to ease of use, both Tableau and Power BI have their strengths:
Tableau: Tableau’s drag-and-drop interface and intuitive design make it easy for users to create interactive dashboards and reports without extensive technical skills. It offers a wide range of customization options and has a shorter learning curve compared to Power BI.
Power BI: Power BI’s interface is similar to other Microsoft products, making it familiar to users already using Microsoft technologies. Its guided setup and pre-built templates make it user-friendly for business users, but it may require more technical expertise for advanced functionalities.
Pricing:
When choosing between Tableau or Power BI, pricing is an important factor to consider. Here is a comparison of pricing model of each:
Tableau: Tableau offers different pricing tiers, including Tableau Desktop (for individual users), Tableau Server (for sharing dashboards across an organization), and Tableau Online (a cloud-based option). Prices vary based on the size of the organization and the number of users, with Tableau Desktop being the most expensive option.
Power BI: Power BI offers a free version with limited functionality, as well as a paid version called Power BI Pro which offers more advanced features. Power BI also offers Power BI Premium, which is a dedicated cloud capacity for organizations with high data usage requirements. Overall, Power BI tends to be more cost-effective, especially for organizations already using Microsoft technologies.
Tableau vs Power BI: Comparison in a Nutshell
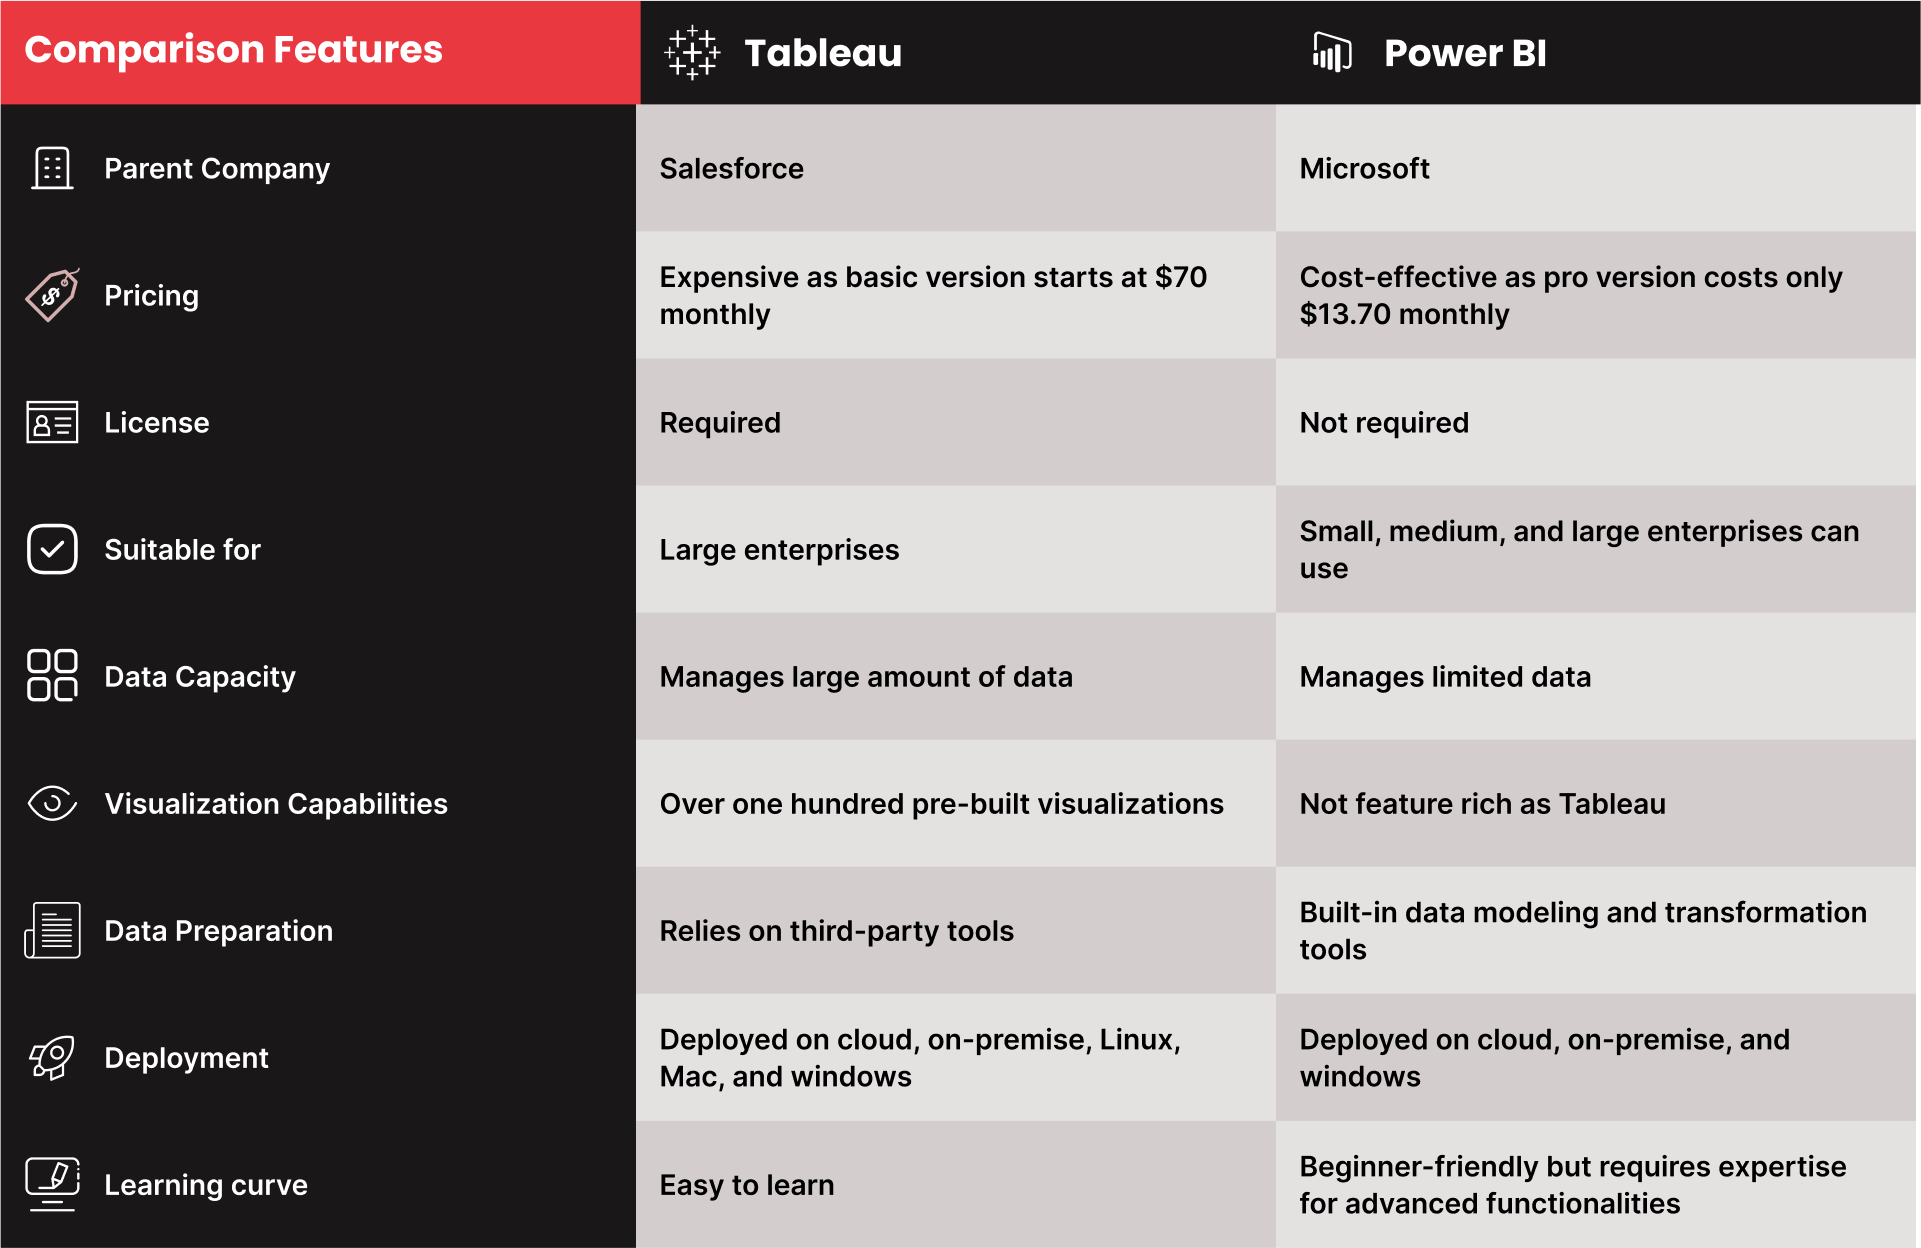
Which is Better- Tableau or Power BI?
Whether you choose tableau or power BI, the final decision should be based on the specific needs and requirements of your organization, and what may be a disadvantage for one organization may not necessarily be a disadvantage for another. Thus, carefully evaluation of these factors is necessary along with consideration of your organization’s unique needs and priorities.
Those who are new to data visualization should go with Power BI as it is easy to learn and user-friendly. It is also a suitable option for businesses with limited resources and data points. Tableau is best for the large-scale enterprises.
Power BI vs Tableau: Frequently Asked Questions
(FAQs)
Q1. Is Power BI and Tableau same?
Both are powerful data visualization and business intelligence tools that allow users to create interactive dashboards, visualizations, and reports to gain insights from data. But, they differ in terms of pricing, ease of use, and integration with other tools and applications
Q2. What is Tableau and Power BI used for?
Tableau and Power BI are used for creating interactive dashboards, visualizations, and reports to gain insights from data.
Q3. Is Power BI or Tableau easy to learn?
Both Power BI and Tableau have a learning curve, but Power BI is generally considered easier to learn and use compared to Tableau.
Q4. Are there any limitations or drawbacks to using Power BI or Tableau?
Yes, both have limitations like Power BI may not offer the same level of advanced features and customization as Tableau, while Tableau may be more expensive and difficult to learn for some users.
Q5. Can Power BI and Tableau be integrated with other tools and applications?
Yes, Power BI and Tableau can be integrated with other tools and applications, including CRM systems, marketing automation platforms, and cloud-based storage solutions.